
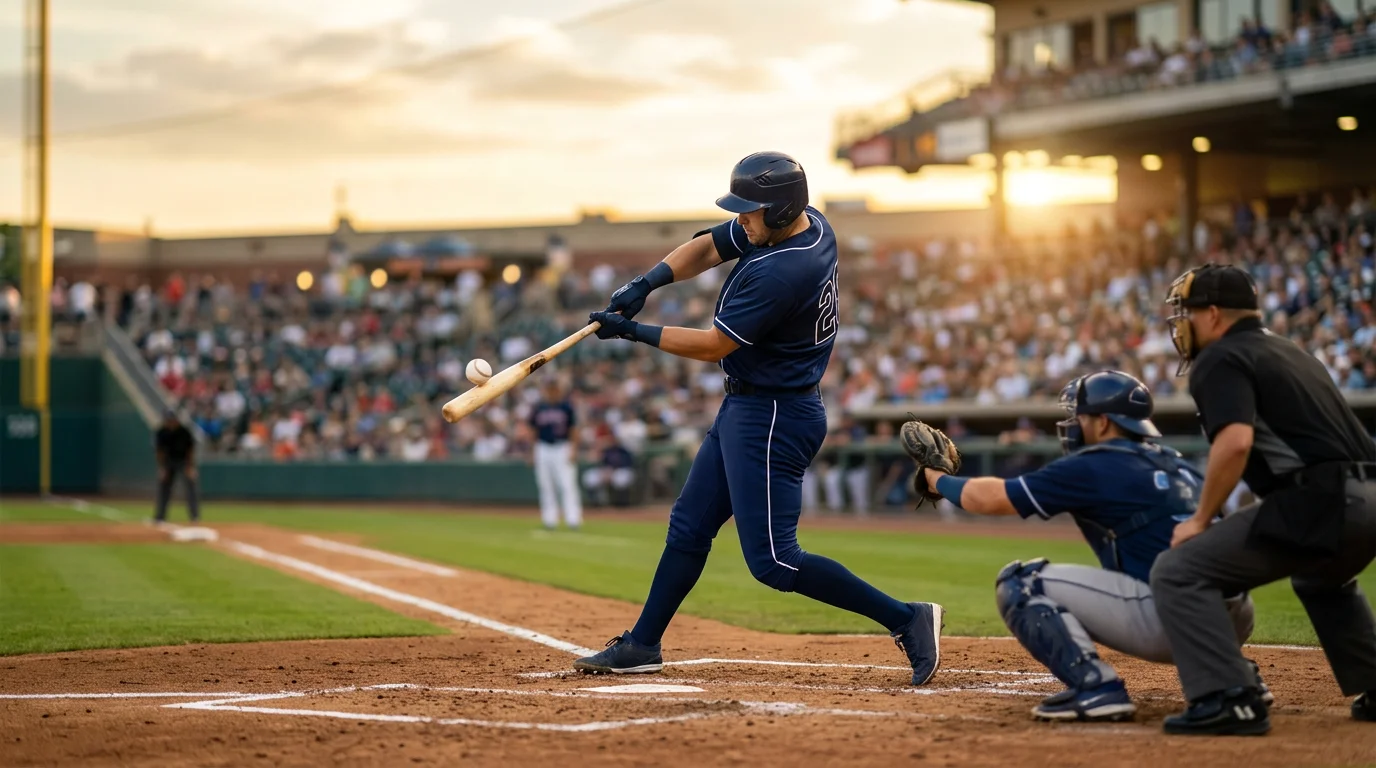
Hitting is the part of baseball where the public market most consistently rewards the wrong stat. Batting average is the dominant headline number on every UK card, and batting average is one of the worst predictors of betting value in the modern game. The first time I ran a back-test ranking hitters by wOBA instead of by batting average, the results came back so cleanly differentiated that I rebuilt my whole hitter-prop pricing model around it. Nine seasons in, and wOBA still does the heavy lifting for any hitter-side analysis I run, with BABIP as the noise filter that tells me whether the headline numbers are real or whether I am being shown a small-sample mirage. The 2025 MLB season produced a record seven players who reached thirty home runs and thirty stolen bases each, an offensive environment where contact quality and luck-driven outcomes are both running hot. Reading wOBA against BABIP across a season of plays is one of the cleanest disciplines a UK hitter-prop punter can build.
What wOBA Actually Rewards
I once explained wOBA to a friend over breakfast and watched his eyes light up about halfway through. The reason he liked it was that it answered a question he had always had about batting average – namely, why a single counts the same as a home run on the average column.
Weighted on-base average solves that problem. The stat assigns each kind of offensive event a weighted value based on how much it actually contributes to scoring runs. A walk is worth a small positive number; a single is worth a slightly larger one; a double is worth more; a triple is worth more again; a home run is worth the most. The weights are calibrated each season against the run-scoring environment, so that a wOBA of .350 in 2025 corresponds to roughly the same offensive value as a wOBA of .350 in 2010, even though the underlying league baseline has shifted.
The output is a number on a scale that looks similar to on-base percentage but means something different. A wOBA below .300 is below average. A wOBA between .310 and .340 is solid. A wOBA above .350 is excellent. A wOBA above .400 is elite – the kind of number a star hitter posts in his peak season. The 2025 average MLB game length sits at around two hours and thirty-eight minutes, which means each plate appearance occupies a smaller fraction of the game’s total time than in the pre-pitch-clock era – but the offensive output per plate appearance, captured by wOBA, has not materially shifted because the underlying contact quality has stayed broadly stable.
The reason wOBA is more useful than batting average on a betslip is that it answers the question hitter props actually require an answer to: how much offensive value will this hitter contribute in this game? Batting average tells you how often he records a hit. wOBA tells you how much each kind of hit is worth.
BABIP as the Luck Indicator
BABIP – batting average on balls in play – is the stat I use to filter out hitters whose recent numbers are riding sequencing variance. The metric measures the rate at which a hitter’s balls in play turn into hits, excluding home runs and strikeouts. The league-average BABIP sits in a narrow band – typically .295 to .305 across recent seasons – and significant departures in either direction are statistical signals.
A hitter with a season BABIP of .380 against a career baseline of .310 is running hot. The headline batting average and on-base numbers are being inflated by balls in play falling for hits at a rate that is unlikely to sustain. Across the rest of the season, the BABIP will drift towards the career baseline, and the headline numbers will follow it down.
A hitter with a season BABIP of .230 against a career baseline of .310 is running cold. The headline numbers are being suppressed by balls in play not falling for hits, and the underlying contact quality may be stronger than the surface stats suggest. The BABIP will drift back up; the headline numbers will follow.
The discipline is to read the BABIP next to the wOBA. A hitter whose wOBA is excellent and whose BABIP is at career baseline is genuinely producing – the price model on his hitter props should respect the headline numbers. A hitter whose wOBA looks excellent but whose BABIP is well above career baseline is over-performing on the surface, and the regression is coming.
Pairing wOBA With Park Context
A hitter’s wOBA is calculated across whatever venues he has actually played in. A pitcher-friendly home park suppresses wOBA below the hitter’s true skill level. A hitter-friendly home park inflates it. Cross-hitter comparison without park adjustment is therefore noisy, and the noise is one of the structural reasons hitter props on a UK card sometimes look mispriced.
The disciplined approach is to read wOBA in conjunction with the venue the hitter is playing in tonight, not just the venue he has accumulated his season-aggregate at. A hitter with a .380 wOBA whose home park is Petco – one of the most pitcher-friendly venues – has a stronger underlying skill than the headline number suggests, because his home games have been suppressing his offensive output. The same number from a hitter whose home park is Coors Field flatters him in the opposite direction.
For the venue-by-venue treatment of how parks shape offensive output, the dedicated explainer on park context overlay for hitter stats walks through the dimensions, altitude and wind effects that distinguish each MLB venue. The takeaway for a wOBA reader is to treat the headline number as a starting point and to ask which venues have produced it.
Using BABIP for Buy-Low Hitter Bets
The most reliable source of value on hitter props comes from buying low on hitters with depressed BABIPs and elevated underlying contact quality. The signal is structural: a hitter whose statcast contact data – exit velocity, barrel rate, hard-hit rate – is strong, but whose surface numbers are being suppressed by a low BABIP, is a regression candidate in the upward direction.
The 2025 season’s seven thirty-thirty hitters were a useful natural experiment in this kind of analysis. Several of those players had brief mid-season stretches where their surface numbers cooled noticeably while their statcast contact stayed elite. The BABIP told the underlying story; the buy-low window on their hitter props was a brief but real period of mispricing before the surface numbers caught back up to the contact quality.
The disciplined approach is to identify hitters whose BABIP is at least thirty points below their career baseline, whose statcast contact remains strong, and whose hitter prop prices reflect the cold surface stats rather than the underlying quality. The buy-low window is rarely longer than two to three weeks before the regression closes the gap.
The Limits of Both Stats and Where Noise Wins
wOBA stabilises after a meaningful sample, but the threshold is higher than for pitching stats. A hitter’s wOBA is roughly stable after three hundred to four hundred plate appearances, which means the first six weeks of a season produce wOBA numbers that are still partially noise. BABIP stabilises later still – closer to seven hundred plate appearances – which means season-to-date BABIP in early summer is sometimes a misleading indicator. Both stats are designed to filter out variance, but neither is immune to it. Use them as filters, not as oracles.
How big a BABIP swing constitutes luck for a hitter sample?
Does wOBA replace OPS for serious MLB punters?
Material created by the team StitchLine