

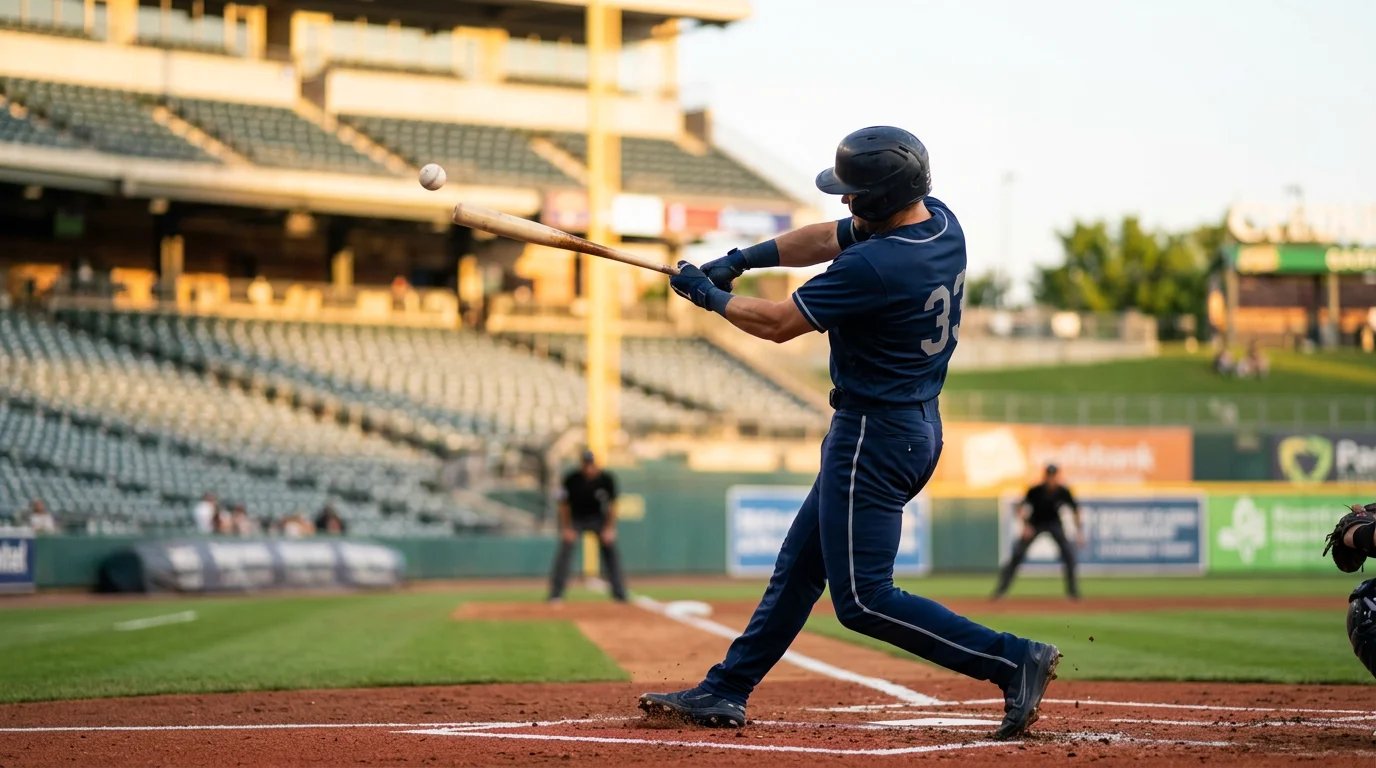
The home run prop is the most romantic bet in baseball. You pick one hitter, you watch four at-bats, you wait for a swing that ends with a ball clearing the wall. Nine seasons working this market for a living, and the romance has never killed the maths – but the maths is what most punters skip past on their way to picking the name they recognise. Seven players hit thirty home runs and thirty stolen bases in the same 2025 season, the most in MLB history for a single campaign, which tells you something about the offensive environment of the modern game and the breadth of legitimate power-hitter targets. This piece walks through how to actually price a home run prop, where the public model bends, and which inputs the screen will not show you.
How To Hit a Home Run Anytime Works in Practice
The first home run prop I ever placed was a Joey Gallo “to hit a home run anytime” at +400 on a calm summer evening in Texas. He went 0-for-4 with three strikeouts. That was an early lesson in the difference between a name that looks like a home run hitter and a probability the bookmaker has priced fairly.
The market is binary in form. Either the named hitter records at least one home run in the game, or the wager loses. Walk-off home runs count. Inside-the-park home runs count. Home runs that come during extra innings count. The hitter has to be in the lineup at first pitch – pinch-hit appearances count for some operators and not for others, so check the small print before placing. Across the league, the typical to-hit-a-home-run-anytime price for a regular-starting hitter sits between +300 and +700 depending on power profile, matchup and venue.
The implied probability range is therefore roughly twelve to twenty-five per cent. The market is not, in general, especially mispriced – pricing models on home run props are mature, and the line moves quickly when public money loads up. The edges are smaller than on totals or run-lines, but they exist for punters willing to study the inputs that matter.
Barrel Rate and Exit Velocity as the Real Inputs
I do not look at home run totals. I look at barrel rate. The reason is structural: home runs are an outcome variable, but barrel rate is the closest available process variable to “did the hitter put a ball into the air at the velocity and angle required to become a home run.” Barrel rate is defined by the league’s tracking system as a contact event with an exit velocity above a certain threshold and a launch angle within a defined window. A hitter with a high barrel rate is a hitter producing the kind of contact that turns into home runs.
Exit velocity is the underlying physical input. Anything north of one hundred miles per hour off the bat starts to clear most major-league fences if the launch angle is right. Anything north of one hundred and ten is virtually a guaranteed home run on the right trajectory, regardless of venue. Hitters whose ninetieth-percentile exit velocity sits in that range are structurally more likely to produce a home run on any given evening than hitters whose top contact peaks below one hundred and four.
The combination matters more than either number alone. The seven players who reached thirty home runs and thirty stolen bases in 2025 share an underlying profile – high barrel rate combined with consistent contact and aggressive baserunning – which makes them outstanding to-hit-a-home-run-anytime candidates even on days when the public model has the price right at +400. The edge over a season is small, but the win rate is high enough that the bets compound favourably across a regular slate.
Pull-Side Tendency and Park Orientation
I once watched a hitter foul off six straight pitches at the right-field line and then yank the seventh into the seats. The lesson was that pull-side power is location-specific. A right-handed hitter who pulls the ball to left field is a different animal at Yankee Stadium, where the left-field line is generously close, than at Comerica Park, where the same fly ball dies in front of the warning track.
The disciplined approach is to read the hitter’s spray chart against the venue’s dimensions. A pull-heavy lefty at Citi Field has a smaller home-run target zone than the same hitter at Yankee Stadium, despite the two parks sitting six miles apart. The right-field porch in the Bronx is a structural advantage for left-handed pull hitters; the corresponding porch in Queens is more demanding. Pull-side rate plus park orientation is the matchup that matters, not raw home-run total at neutral venue.
The asymmetry runs the other way too. A right-handed hitter who hits the ball the other way to right-centre is a different proposition at Petco Park, where right-centre is a graveyard, than at Great American Ball Park in Cincinnati, where the dimensions are more forgiving. The hitter’s spray-chart shape determines which venues amplify and which suppress the home-run probability.
Pitcher Fly-Ball Tendency
The pitcher is half the equation. A starter who induces ground balls roughly fifty-five per cent of the time is a structural enemy of the home-run prop. A starter who allows fly balls fifty per cent of the time is a structural ally. The relevant statistic is fly-ball rate against the hitter’s hand – left-handed-batter fly-ball rate against a left-handed starter, right-handed-batter fly-ball rate against a right-handed starter – because the platoon split alters the underlying physics of the contact.
The other relevant pitcher number is HR/FB ratio, which captures how often a fly ball allowed by this pitcher actually leaves the park. A pitcher with a season HR/FB above thirteen per cent is a more dangerous home-run-prop opponent than one with a season HR/FB below nine per cent. Pace-of-play reforms have compressed the average MLB game length to around two hours and thirty-eight minutes, which has slightly reduced total pitch counts per starter, but pitch counts per inning have stayed roughly stable, which means the underlying physics of fly-ball-allow rate has not changed materially. The pitcher’s fly-ball profile remains a stable input.
Weather and Altitude as the Final Multiplier
The single most under-priced variable on a home-run prop is the wind. A seven-mile-an-hour breeze blowing out at Wrigley Field on a July afternoon can convert a warning-track fly ball into a home run, and the public price model on a to-hit-a-home-run-anytime market often only partially absorbs the wind data because the books are pricing for an aggregate audience that is not always checking the forecast. Altitude is the other obvious multiplier – Coors Field is a separate physical environment from sea-level ballparks, and the home-run prop prices reflect that, but the venue-by-venue micro-effects across the rest of the league are subtler. For a fuller treatment of park-by-park factors for power hitters, the dedicated explainer walks through the dimensions, the dimensions, and the dimensions of every venue. The takeaway for a home-run-prop bettor is to add weather and altitude as the final layer over barrel rate, pull-side tendency, pitcher profile and lineup spot, then weigh the price the operator has printed against your composite read.
Are HR prop odds influenced more by the hitter's barrel rate or the pitcher's fly-ball rate?
Why does a 7 mph wind blowing out at Wrigley shift HR prop pricing?
Material created by the team StitchLine